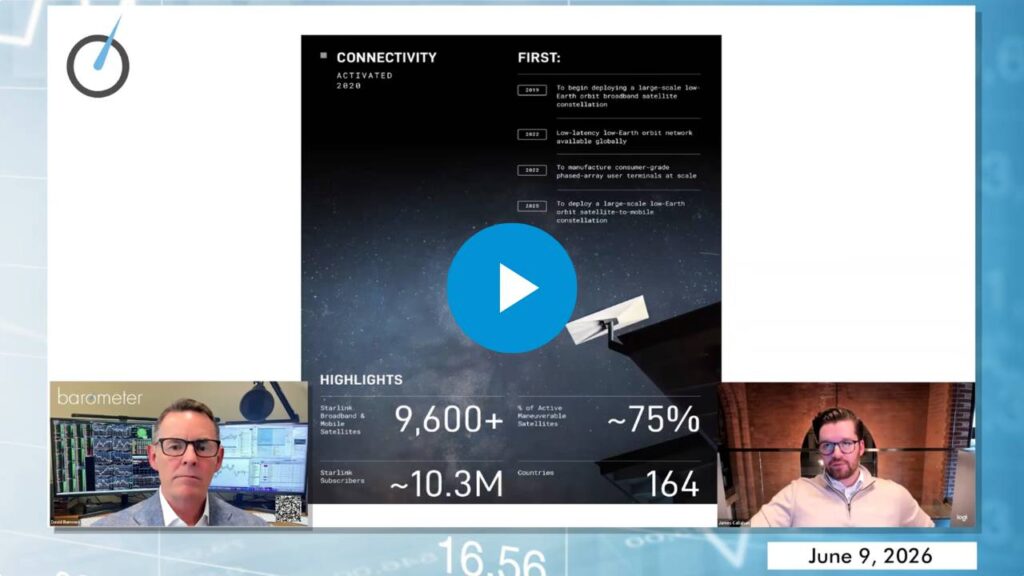
Barometer Capital

Barometer Readings Webcasts

Market conditions deteriorated this week as breadth weakened across regions and sectors. The percentage of stocks in uptrends fell. About 10% of NYSE stocks gave point-and-figure sell signals. The share of stocks above their 50-day moving averages

The US market remains in a secular bull that begins in 2013, and the S&P continues to work higher over time while staying well above the 200-day moving average. Near term, the S&P chops sideways from early

Markets have been choppier in February, with volatility picking up and leadership diverging beneath the surface. The S&P 500 is down about 1.5% for the month and roughly flat on the year, and it has moved below

Markets continue to be in a long-term upward trend, yet the beginning of the year has revealed notable disparities among various sectors. While the overall index appears inconsistent, the underlying indicators are more robust. The equal-weight S&P

Markets have started the year trading much like they ended last year, with broader participation and strong relative performance in commodities and industrially linked areas alongside improved results outside the US. January saw significant bullish flow, but

No more posts to show